| |
中国
China |
日本
Japan |
美国
US |
德国
Germany |
法国
French |
英国
UK |
俄罗斯
Russia |
韩国
ROK |
墨西哥
Mexico |
|
本国人
Domestic |
1532 |
129937 |
61707 |
19521 |
13233 |
4549 |
25644 |
14497 |
112 |
|
外国人
Foreign |
1962 |
17749 |
50277 |
35532 |
37215 |
40205 |
4048 |
10082 |
3832 |
|
合计
Total |
3494 |
147686 |
111984 |
55053 |
50448 |
44754 |
29692 |
24579 |
3944 |
|
位次
Rank |
27 |
1 |
2 |
3 |
4 |
5 |
6 |
8 |
24 |
数据来源:世界知识产权组织工业产权统计(1997)。
Source:WIPO,Industrial Property Statistics (1997).
|
4 -4
|
全国科技论文发表数(1993~1999)
National scientific and technical publications |
|
| |
1993 |
1994 |
1995 |
1996 |
1997 |
1998 |
1999 |
在国内刊物上发表的论文数*
Publications in domestic journals |
101983 |
107492 |
107991 |
116778 |
120851 |
133958 |
161692 |
|
三系统收录我国的科技论文数
Scientific and technical papers
catalogued by SCI、ISTP and EI |
20178 |
24584 |
26395 |
27569 |
35311 |
35003 |
46188 |
* 在国内刊物上发表的论文篇数是根据1300余种国内科技刊物上发表的论文统计的。
The data of domestic publications are based on about 1300 journals of China.
|
4 -5
|
三系统和科学引文索引收录的部分国家科技论文数(1999)
S&T papers of selected countries catalogued by SCI, EI and ISTP as a whole and as a SCI |
|
国别
country |
三系统 SCI,ISTP & EI |
SCI |
|
论文篇数
Papers |
% |
位次
Rank |
论文篇数
Papers |
% |
位次
Rank |
|
世界合计 Total |
1413513 |
100.00 |
|
973286 |
100.00 |
|
|
中国 China |
46188 |
3.27 |
8 |
24476 |
2.51 |
10 |
|
美国 USA |
434272 |
30.72 |
1 |
314120 |
32.27 |
1 |
|
日本 Japan |
124627 |
8.82 |
2 |
80052 |
8.22 |
3 |
|
英国 UK |
116983 |
8.28 |
3 |
92089 |
9.46 |
2 |
|
德国 Germany |
105765 |
7.48 |
4 |
76049 |
7.81 |
4 |
|
法国 French |
76611 |
5.42 |
5 |
54753 |
5.63 |
5 |
|
加拿大 Canada |
53325 |
3.77 |
6 |
38710 |
3.98 |
6 |
|
意大利 Italy |
52806 |
3.74 |
7 |
36506 |
3.75 |
7 |
|
俄罗斯 Russia |
40240 |
2.85 |
9 |
28163 |
2.89 |
8 |
|
印度 India |
24471 |
1.73 |
13 |
18724 |
1.92 |
13 |
|
4 -6
|
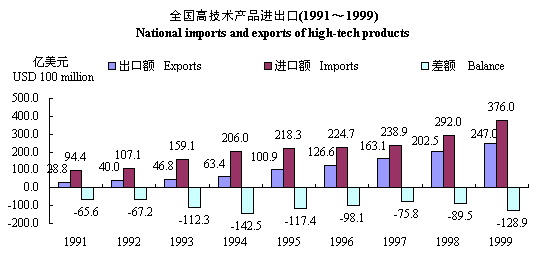
全国高技术产品进出口情况(1993~1999)
National Imports and exports of high-tech products |
|
| |
1993 |
1994 |
1995 |
1996 |
1997 |
1998 |
1999 |
|
高技术产品出口额
Exports of high-tech products |
4676 |
6342 |
10091 |
12263 |
16310 |
20251 |
24704 |
占商品出口总额的比重(%)
Share in total exports
|
5.1 |
5.2 |
6.8 |
5.1 |
5.3 |
11.0 |
12.7 |
占工业制成品出口额的比重
Share in industrial manufactured exports
|
6.2 |
6.3 |
7.9 |
5.9 |
6.1 |
12.4 |
14.1 |
|
高技术产品进口额
Imports of high-tech products |
15909 |
20595 |
21827 |
22469 |
23893 |
29201 |
37598 |
占商品进口总额的比重
Share in total imports
|
15.3 |
17.8 |
16.5 |
13.6 |
13.9 |
20.8 |
22.7 |
占工业制成品进口额的比重
Share in industrial manufactured imports
|
17.7 |
20.8 |
20.3 |
16.6 |
17.4 |
24.9 |
27.1 |
|
4 -7
|
全国高技术产品进出口按领域分布(1999)
National imports and exports of high-tech products by field |
|
| |
出口
Exports |
进口
Imports |
差额
Balance |
|
合计Total |
247.04 |
375.98 |
-128.94 |
计算机与通信技术 Computers and telecommunications
|
172.51 |
149.14 |
23.38 |
|
|
10.67 |
12.30 |
-1.64 |
|
|
42.06 |
117.99 |
-75.93 |
计算机集成制造技术 Computer integrated manufacturing
|
3.95 |
42.24 |
-38.29 |
|
|
6.63 |
36.80 |
-30.17 |
|
|
6.99 |
6.15 |
0.84 |
|
|
1.04 |
0.42 |
0.61 |
|
|
1.33 |
6.20 |
-4.88 |
|
|
1.86 |
4.73 |
-2.87 |
|
4 -8
|
全国各地区高技产品进出口情况(1999)
National imports and exports of high-tech products by region |
|
地区
Region |
出口Exports |
进口Imports |
差额Balance |
|
地区
Region |
出口
Exports |
进口
Imports |
差额
Balance |
|
北京 Beijing |
1103 |
7600 |
-6497 |
湖北 Hubei |
107 |
265 |
-157 |
|
天津 Tianjin |
1632 |
1968 |
-337 |
湖南 Hunan |
31 |
195 |
-164 |
|
河北 Hebei |
43 |
151 |
-107 |
广东 Guangdong |
12030 |
12979 |
-949 |
|
山西 Shanxi |
4 |
26 |
-22 |
广西 Guanxi |
18 |
89 |
-71 |
|
内蒙古 Inner Mongolia |
1 |
30 |
-29 |
海南 Hainan |
18 |
90 |
-72 |
|
辽宁 Liaoning |
902 |
1079 |
-177 |
重庆 Chongqing |
28 |
83 |
-55 |
|
吉林 Jilin |
12 |
166 |
-154 |
四川 Sichuan |
145 |
732 |
-587 |
|
黑龙江 Heilongjiang |
43 |
181 |
-137 |
贵州 Guizhou |
1 |
21 |
-20 |
|
上海 Shanghai |
3304 |
5647 |
-2342 |
云南 Yunnan |
39 |
75 |
-36 |
|
江苏 Jiangsu |
3253 |
2922 |
331 |
西藏 Tibet |
1 |
7 |
-6 |
|
浙江 Zhejiang |
351 |
763 |
-412 |
陕西 Shaanxi |
45 |
417 |
-371 |
|
安徽 Anhui |
32 |
66 |
-34 |
甘肃 Gansu |
10 |
13 |
-4 |
|
福建 Fujian |
1062 |
1204 |
-142 |
青海 Qinghai |
0 |
5 |
-5 |
|
江西 Jiangxi |
16 |
37 |
-21 |
宁夏 Ningxia |
2 |
14 |
-12 |
|
山东 Shandong |
450 |
638 |
-188 |
新疆 Xinjiang |
3 |
66 |
-63 |
|
河南 Henan |
16 |
70 |
-54 |
|
|
|
|